Note
Access to this page requires authorization. You can try signing in or changing directories.
Access to this page requires authorization. You can try changing directories.
Exposes Dev Proxy messages, and information about intercepted requests and responses in Chrome DevTools. Supports both HTTP requests and STDIO communication.
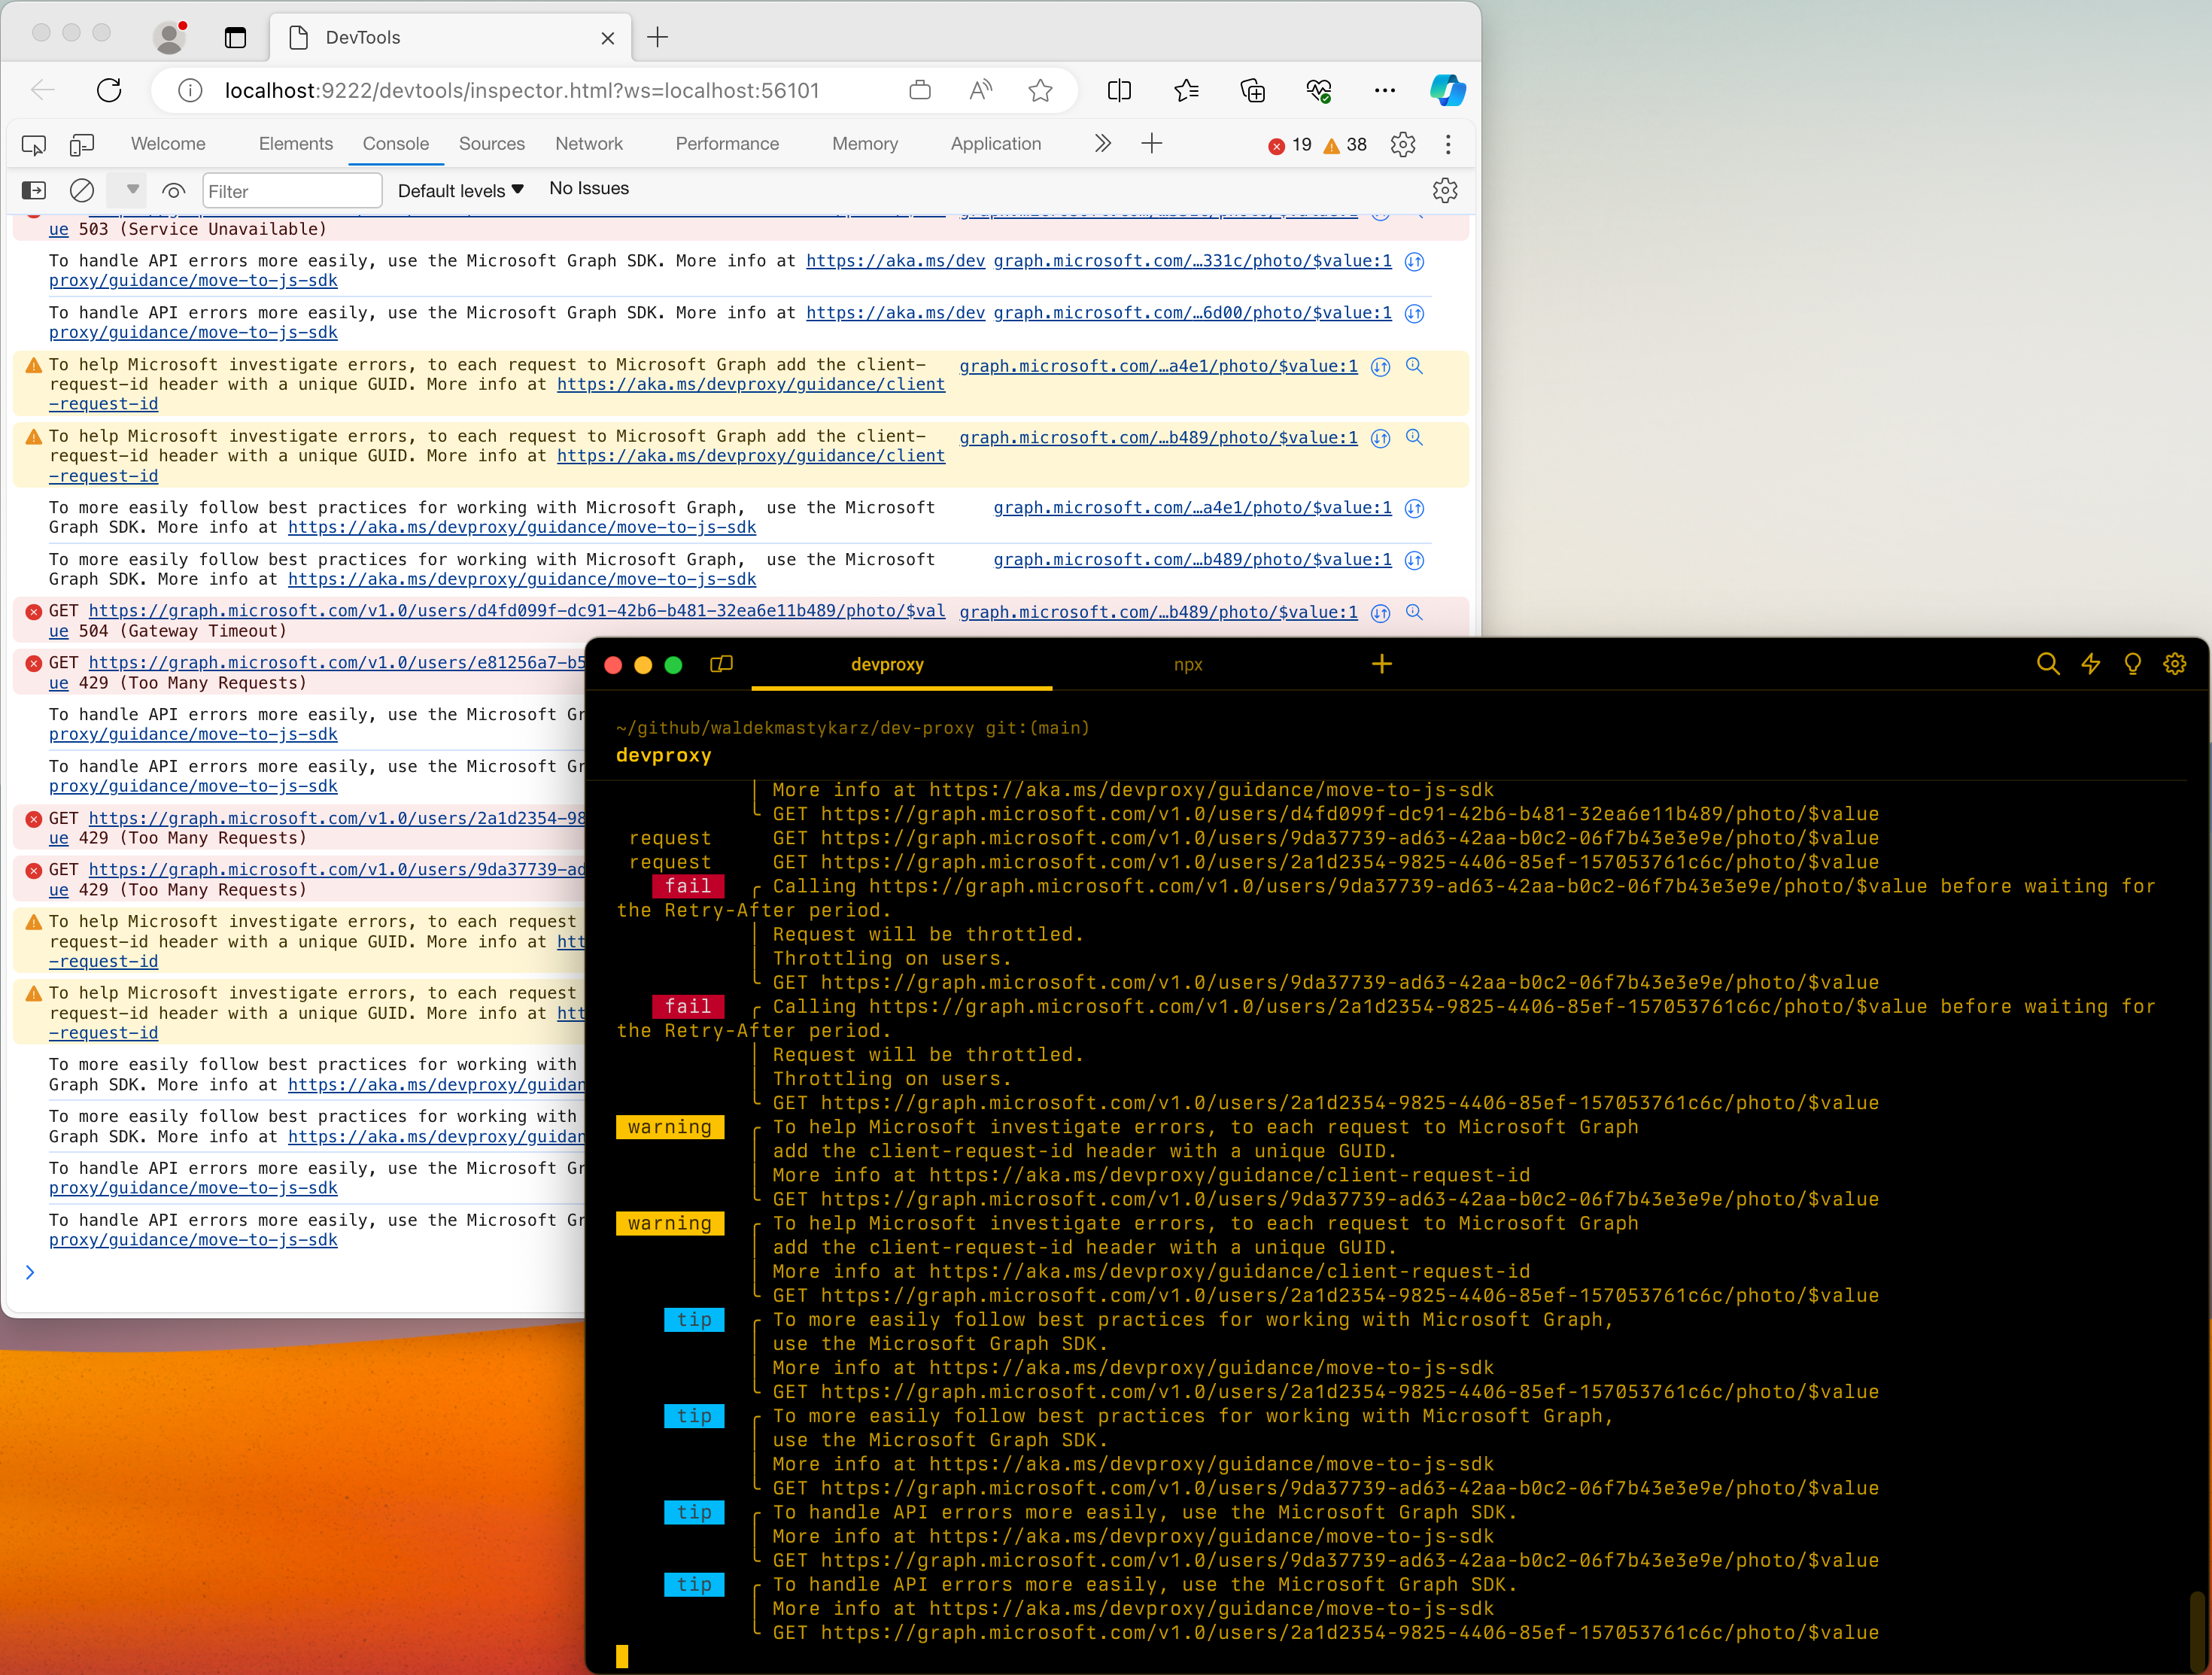
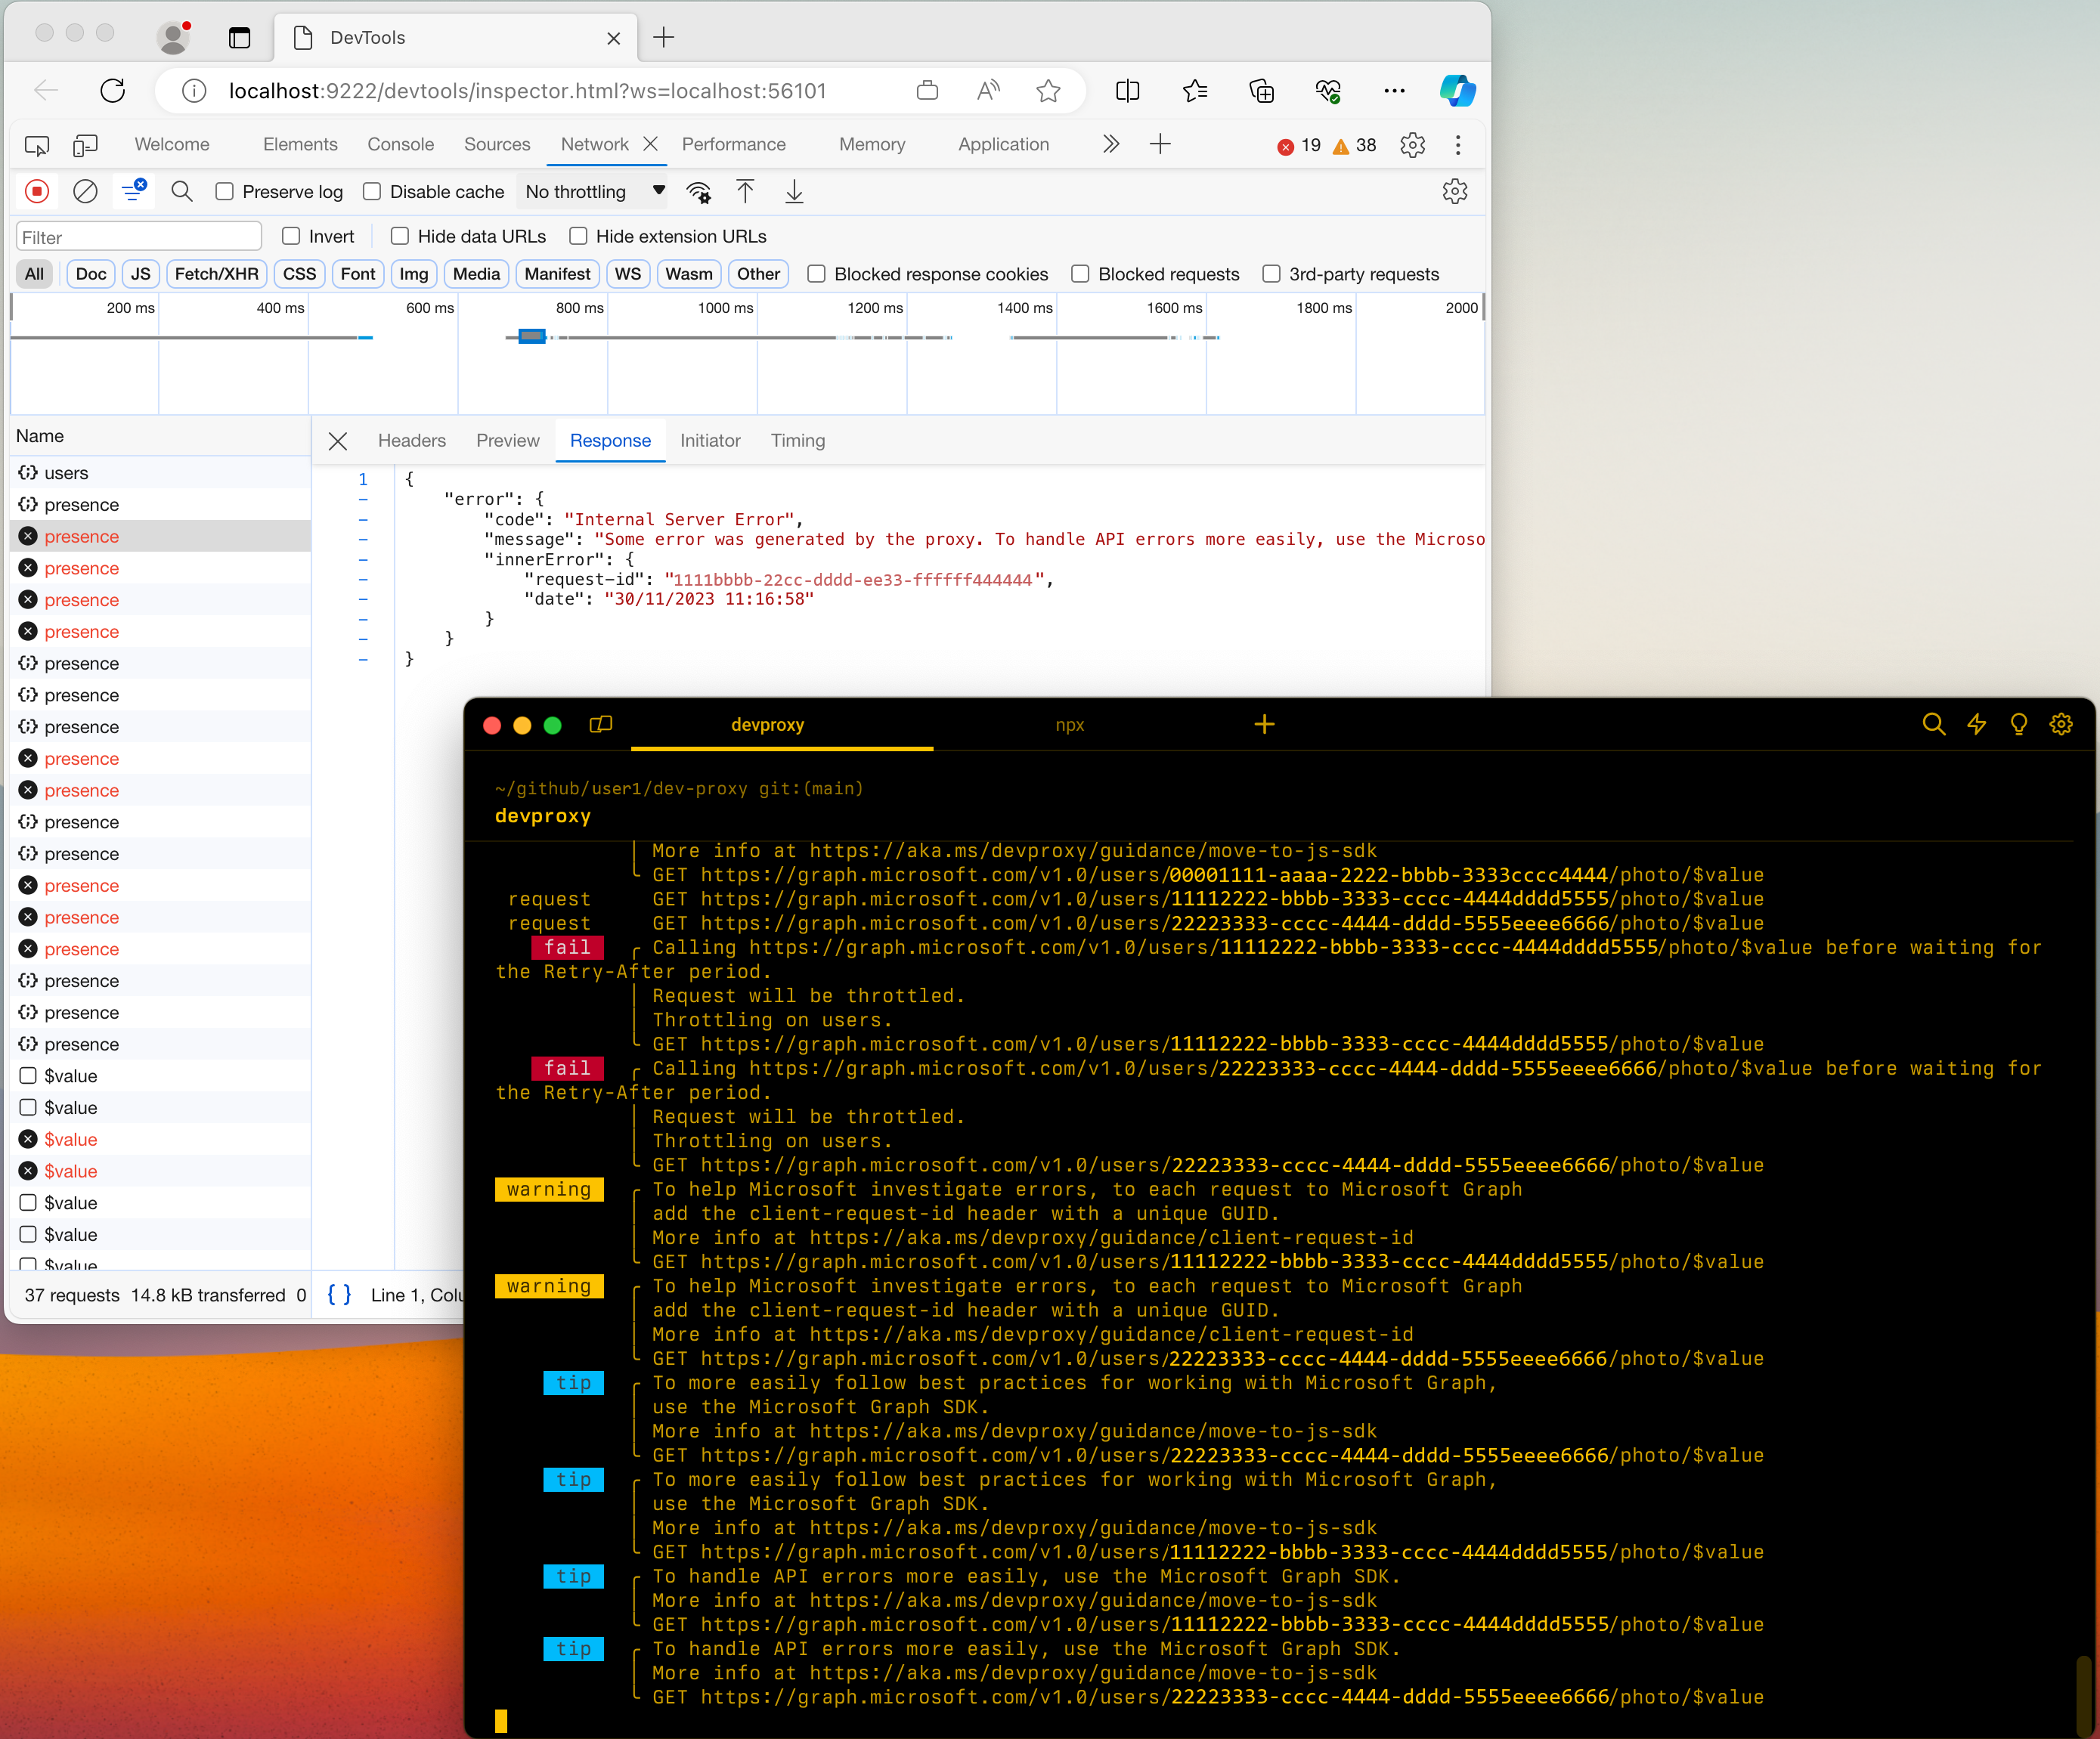
Configuration example
{
  "$schema": "https://raw.githubusercontent.com/dotnet/dev-proxy/main/schemas/v4.0.0/rc.schema.json",
  "plugins": [
    {
      "name": "DevToolsPlugin",
      "enabled": true,
      "pluginPath": "~appFolder/plugins/DevProxy.Plugins.dll",
      "configSection": "devTools"
    }
  ],
  "devTools": {
    "$schema": "https://raw.githubusercontent.com/dotnet/dev-proxy/main/schemas/v4.0.0/devtoolsplugin.schema.json",
    "preferredBrowser": "Edge"
  }
}
Configuration properties
| Property | Description | Default |
|---|---|---|
preferredBrowser |
Which browser to use to launch Dev Tools. Supported values: Edge, EdgeDev, Chrome |
Edge |
port |
Port on which the plugin listens for DevTools connections. 0 picks a random available port. Use a fixed port when you need to publish it, for example, when you run Dev Proxy in a container |
0 |
launchBrowser |
Whether to launch the browser with Dev Tools. When false, the plugin doesn't launch a browser and logs the Dev Tools URL instead, which you open in Microsoft Edge or Google Chrome yourself |
true |
Command line options
None
Remarks
The plugin listens for Dev Tools connections on the IP address that Dev Proxy uses, which you set using the --ip-address option. When you set it to 0.0.0.0 or ::, the plugin listens on all interfaces and the Dev Tools URL points to 127.0.0.1. On Windows, listening on all interfaces requires admin rights or a URL ACL. If the plugin can't listen on all interfaces, it listens on 127.0.0.1 instead, so you can only connect Dev Tools from the same machine.
To protect intercepted traffic, the plugin only accepts Dev Tools connections that:
- use the URL that Dev Proxy launches or logs. The URL contains a random token that Dev Proxy generates each time it starts.
- come from the Chrome DevTools frontend, either
devtools://devtools,http://localhost:9222, orhttp://127.0.0.1:9222.
The plugin rejects other connections with 403 Forbidden and logs a warning.
To use the plugin when Dev Proxy runs in a container, a dev container, or GitHub Codespaces, set port to a fixed port, set launchBrowser to false, and publish or forward the port to your machine. For more information, see Inspect requests when Dev Proxy runs in a container.
Known issues
Dev Tools don't open in Microsoft Edge on Windows
You use Dev Proxy on Windows and configure it to use Microsoft Edge to display Dev Tools. After you start Dev Proxy, it starts the inspector but Dev Tools don't open or they open empty.
To fix this issue:
- Open Microsoft Edge
- Go to Settings
- Open System and performance
- Disable Startup boost
- Close all Microsoft Edge windows and processes
- Start Dev Proxy
STDIO support
When using the DevToolsPlugin with the stdio command, you can inspect STDIN/STDOUT/STDERR communication in Chrome DevTools:
- Messages appear with
stdio://command-nameURLs - Requests show as
STDINmethod - Responses show as
STDOUT(200 status) orSTDERR(500 status) - Message bodies are formatted as JSON when applicable
- Timing information is available for each request/response pair
Configuration example for STDIO
{
  "$schema": "https://raw.githubusercontent.com/dotnet/dev-proxy/main/schemas/v4.0.0/rc.schema.json",
  "plugins": [
    {
      "name": "DevToolsPlugin",
      "enabled": true,
      "pluginPath": "~appFolder/plugins/DevProxy.Plugins.dll",
      "configSection": "devTools"
    }
  ],
  "devTools": {
    "$schema": "https://raw.githubusercontent.com/dotnet/dev-proxy/main/schemas/v4.0.0/devtoolsplugin.schema.json",
    "preferredBrowser": "Edge"
  }
}
Then run:
devproxy stdio npx -y @modelcontextprotocol/server-filesystem
Next step
Collaborate with us on GitHub
The source for this content can be found on GitHub, where you can also create and review issues and pull requests. For more information, see our contributor guide.
